
Drone Survey & AutoCAD: Contours
Drone Survey & AutoCAD: Contours
Contouring, in surveying, is the determination of elevation of various points on the ground. When used traditional methods like total station, taking elevation data is a very tedious task and even if one gathers the data, it is very limited. Surveying through drone is a big relief knowing the fact that it takes less time and provides more & accurate points. Once the results are generated, getting contour is merely a click of button.
In this article, we will learn about the contour, terms related to contour, their characteristics and uses. We will also learn to examine contours and determine the nature of the land. The same content has been posted in video format on our YouTube channel SurveGyaan by Surveyaan.
Starting with the contour, it is an imaginary line which connects points of equal elevation.
The process of tracing these lines on the earth’s surface is called as contouring.
The contour lines in an area are drawn keeping difference in elevation of between two consecutive lines constant and this difference is known as Contour Interval. If the ground has large variation in levels, for instance, hills and ponds, or For small scale maps covering a wide area of varying terrain, or for rough topographical map meant for initial assessment only, then High Contour Interval can chosen. If the terrain is fairly level, or for preparation of detailed map for execution of work, Small Contour Interval can be selected.
Charaterstics of Contour
Charaterstics of Contour
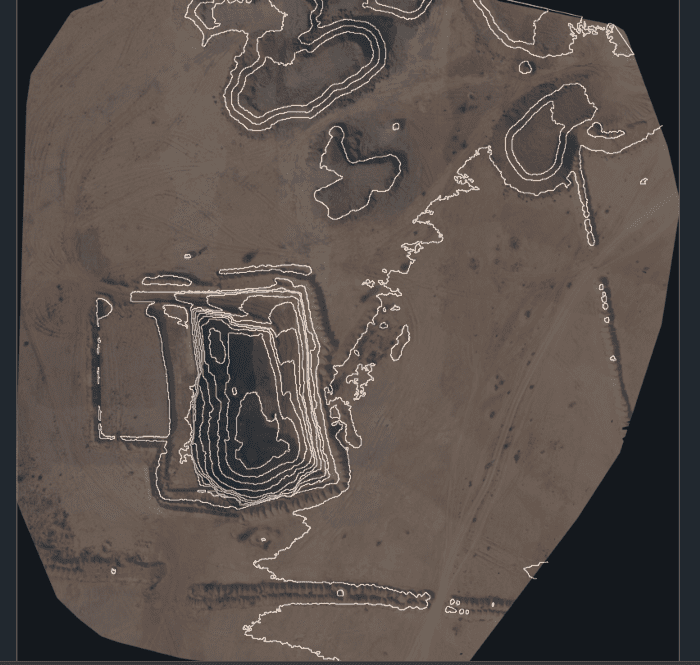
To explain the characteristics, AutoCAD drawing file, containing contour lines, has been used. For the same map, you may create a new layer and import orthomosaic. You can learn more about orthomosaic on this blog.
- Two contours of different elevation do not cross each other with only exception in the contours of a overhanging cliff.
- All the points in the contour are at the same elevation.
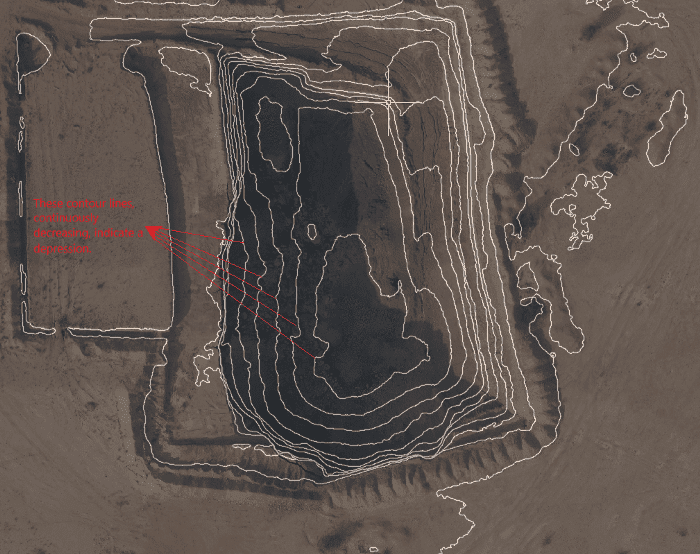
- A series of closed interval with lower elevation indicates a depression. For example, a mine pit.
- A series of closed interval with higher elevation indicates a hill. For example, a stockpile.
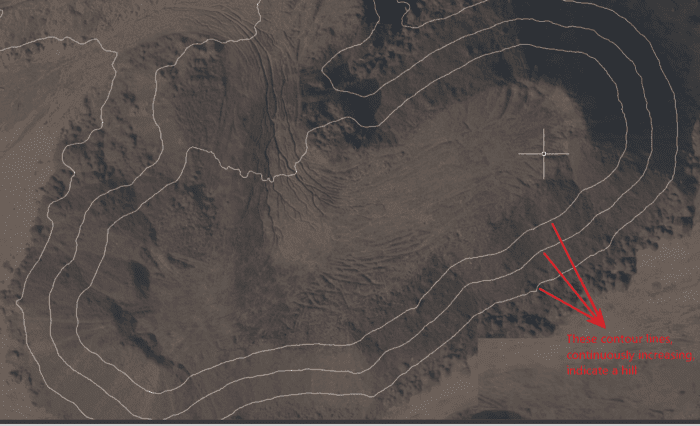
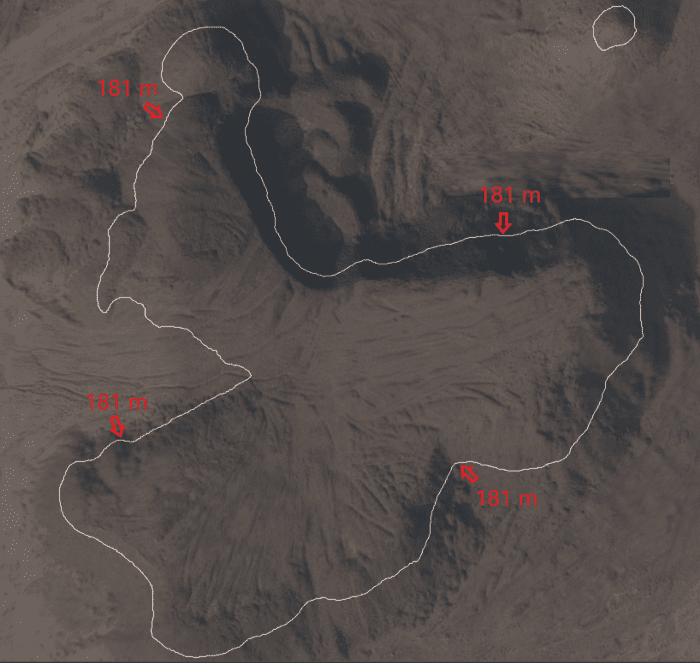
- Equally spaced contour lines indicate a uniform slope.
- Widely spaced lines indicates the flat ground.
- A series of straight, parallel and equally spaced contours represent a plane surface like a Building.
Use Cases
Use Cases
- Contour lines can be used for determining the nature of the surface like sloppy, hilly or flat and it’s slope can be estimated.
- Military troops used them for their operation.
- They can be used for obtaining data used in the design and construction.
- Earth work can be estimated for civil engineering projects like road works, railway, canals, dams etc.
- They can be used for alignment of road, canals, railways, etc.