The spatial characteristics of features can be stored in GIS in one of 2 ways: Vector data or Raster data.
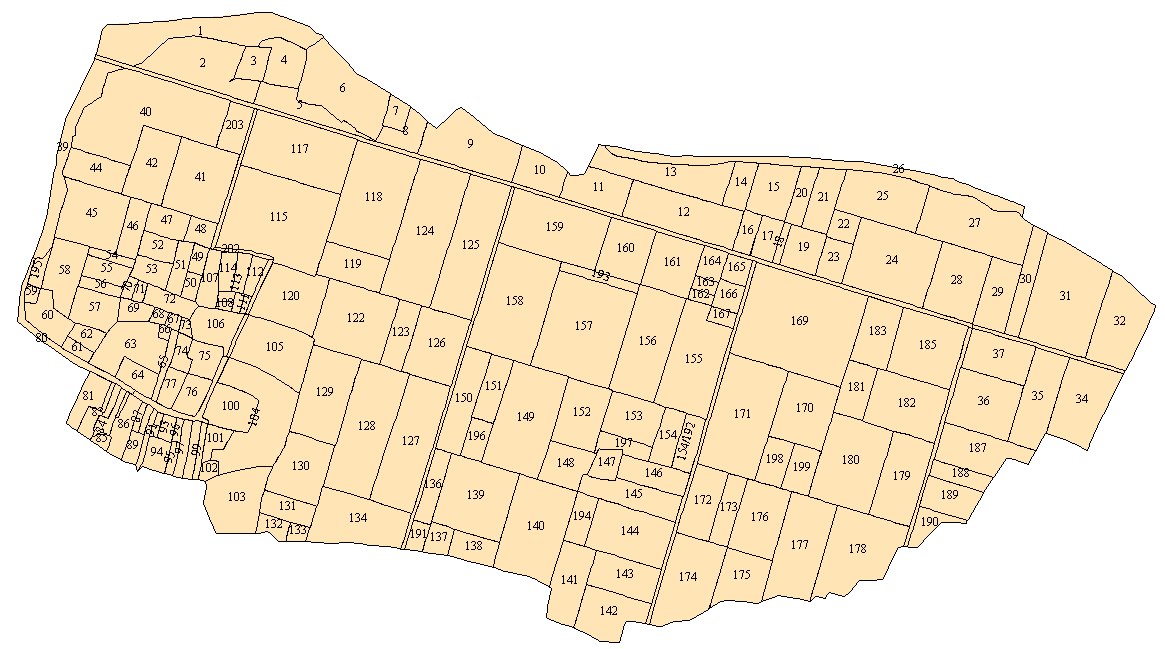
Vector is a data structure that can be used to store spatial data. It is used to represent real-world features and assign attributes to those features. Vector data comprises of individual points, stored as coordinate pairs that indicate a physical location in the world. Data in this format can have a geometry type of point, line, and polygon.
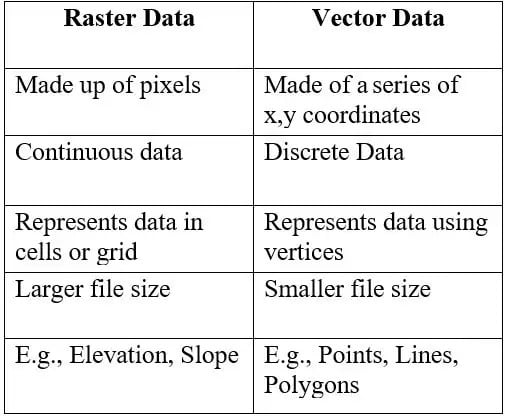
Difference between Raster Data and Vector Data
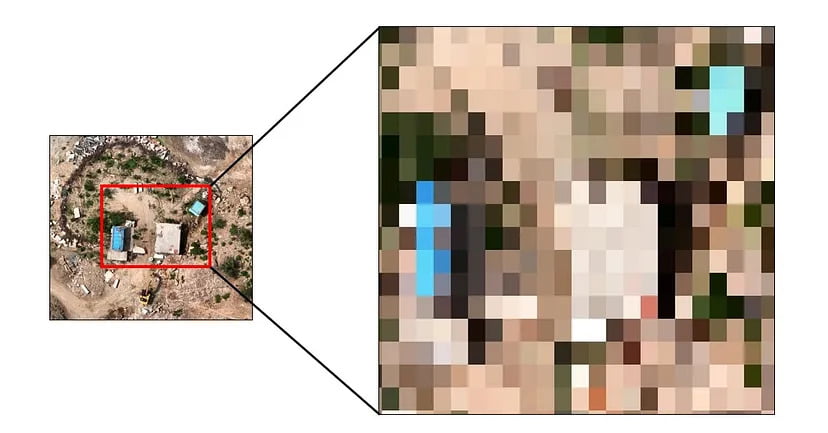
Raster data is made up of pixels (also referred to as grid cells). Each pixel is associated with a specific geographical location. Raster data is an abstraction of the real world. It is used in Aerial imagery, satellite images, and shaded relief raster’s as the base layer when making maps to provide more meaning to the vector information.
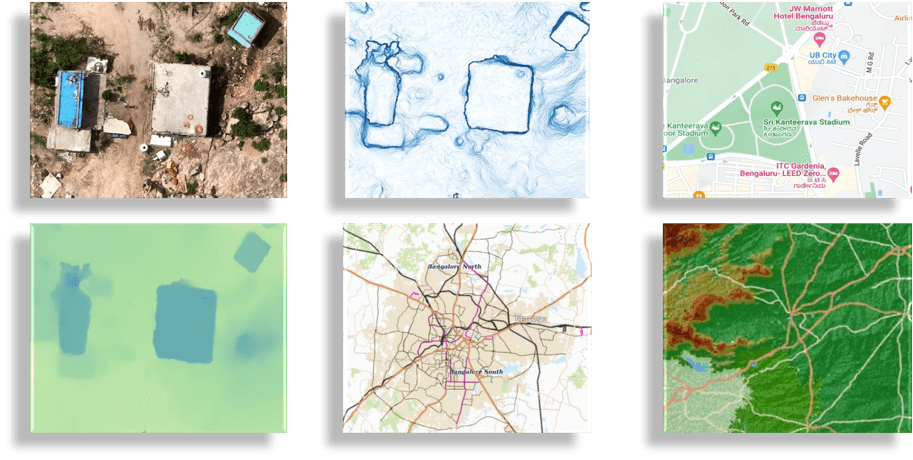
Continuous and Discrete Raster Data
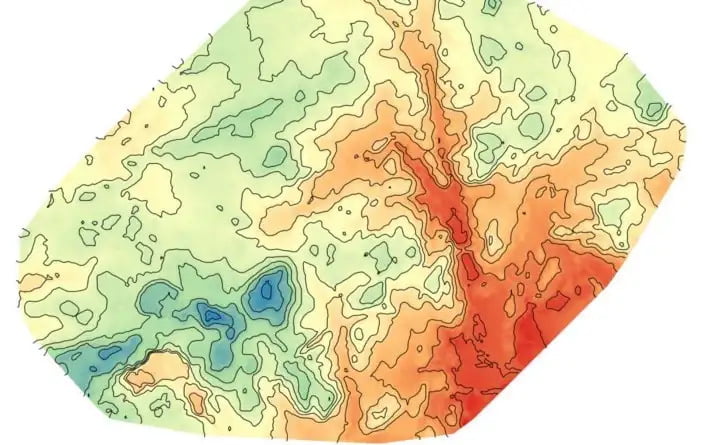
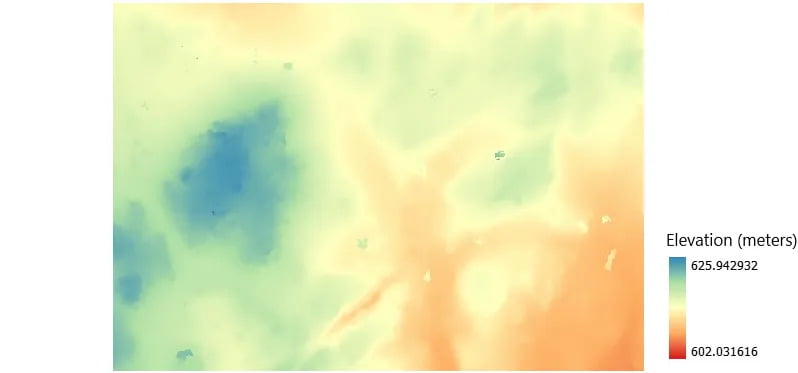
Continuous data has no clearly defined boundaries. Some continuous data examples are temperature, rainfall, and elevation measurements.
Continuous data has no clearly defined boundaries. Some continuous data examples are temperature, rainfall, and elevation measurements.
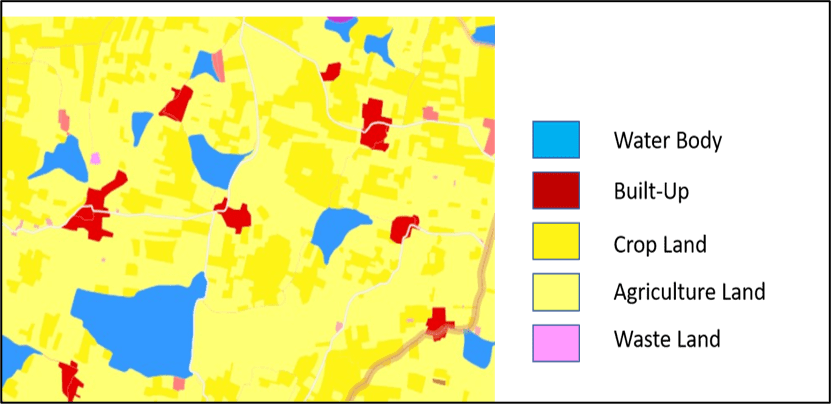
Discrete data is geographic data that only occurs in specific locations and can exist independently.
Advantages of Raster Data
- Data structure: It has a simple matrix of cells with values representing a coordinate.
- Simulation: It is easy because cells have the same size and shape.
- Performance: It has a good ability to represent continuous features and perform surface analysis.
- Compatibility: Compatible with remote sensing images and aerial images.
- Cost: The application software is cheaper.
Disadvantages of Raster Data
- Representation: It is hard to represent objects less than cell size.
- Spatial Resolution: Finer resolution generates vast amounts of data.
- Size: Datasets are enormous.
- Topology: It is challenging to represent topological connections.
- Accuracy: Precise locations may not be recorded as accurately as Vector data.
Raster Data Formats
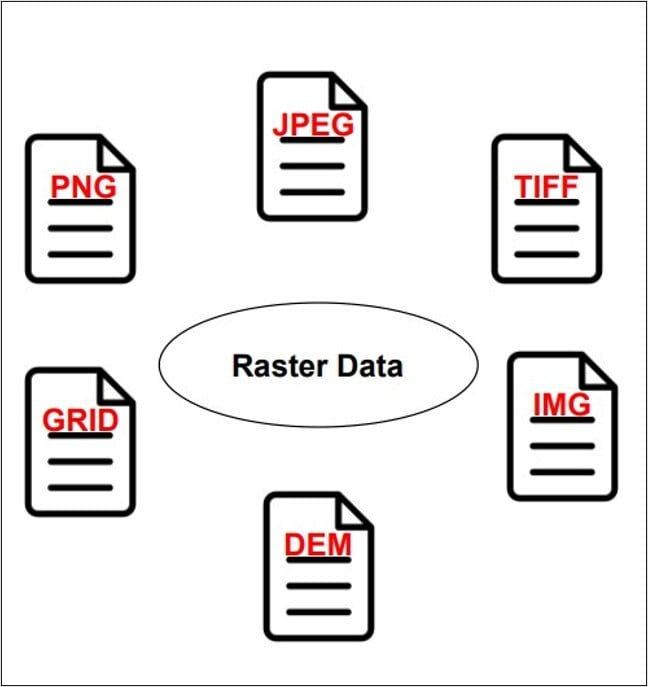
Each raster format represents a different way of storing geospatial data on a computer. Each data format is more or less suited to specific types of projects.
- Portable Network Graphics (PNG): It is a raster file format that allows lossless Compression. Lossless compression reduces file size without decreasing image quality. They are designed for efficient viewing in web-based browsers such as Internet Explorer, Firefox, and Chrome.
You can edit text on your website by double clicking on a text box on your website. Alternatively, when you select a text box a settings menu will appear. your website by double clicking on a text box on your website. Alternatively, when you select a text box
- JPEG (Joint Photographic Experts Group): It is a commonly used method of lossy compression for photographic images. In lossy compression, the data in a file is removed and not restored to its original form after decompression. This data loss is not usually noticeable to the naked eye.
- Tag Image File Format (TIFF): A computer file that stores raster graphics and image information. They hold high-quality images and have either a .tiff or .tif extension. They are a lossless form of file compression.
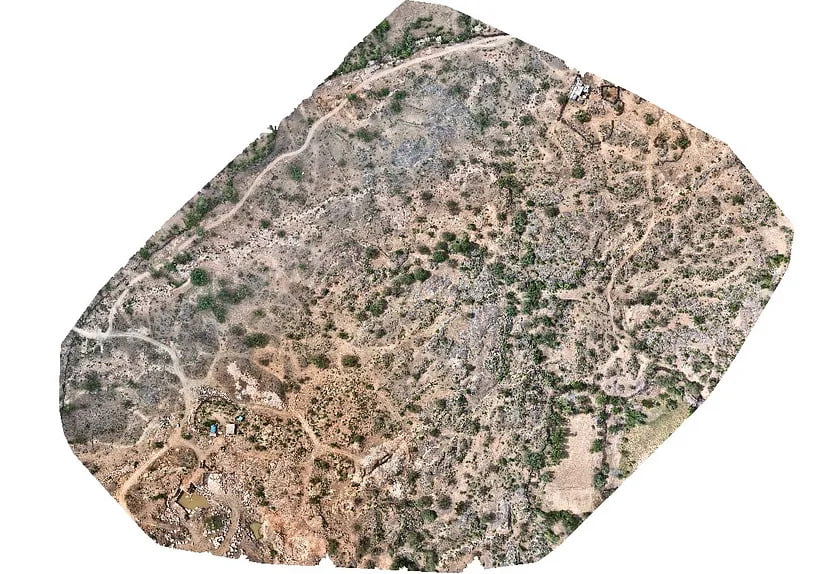
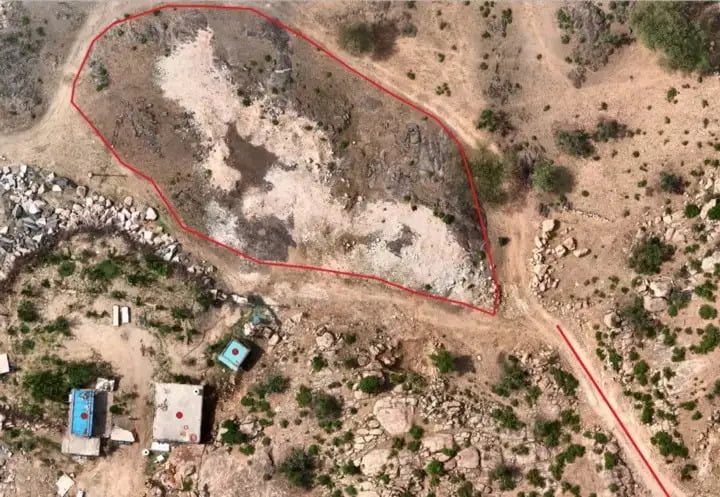
In Figure above, the Orthomosaic map is in TIFF format and can be opened in any GIS software. These files contain a .tif extension.
- GRID: It is a raster GIS file format developed by Esri. It has a proprietary binary format and a non-proprietary ASCII format. The binary format is widely used within Esri software, such as ArcGIS. In contrast, the ASCII format is used as an exchange, or export format, due to the simple and portable ASCII file structure.
- IMG: It is a proprietary, partially documented format for multi-layer geo-referenced raster images developed originally for use with ERDAS IMAGINE software. This format is used widely for processing remote sensing data since it provides a framework for integrating sensor data and imagery from many sources.
- USGS Digital Elevation Model (DEM): It is a popular file format due to widespread availability, the simplicity of the model, and the extensive software support for the format. Each pixel value in these grid-based DEMs denotes spot elevations on the ground, usually in feet or meters. In their native format, they are written as ANSI-standard ASCII characters in fixed-block format.
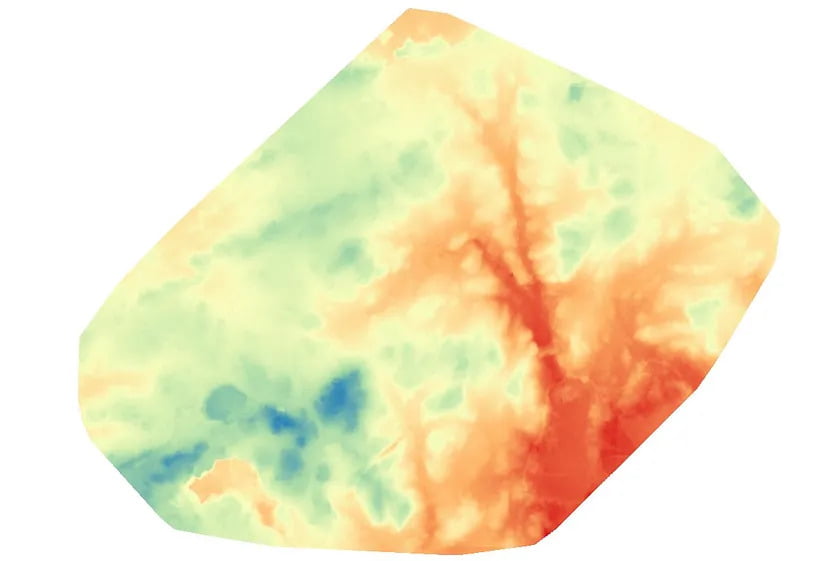
In Figure above, the Digital Surface Model map can be opened in any GIS software. The Digital Surface Model is a subset of DEM and consists of the earth’s surface, including all objects like buildings, trees, etc.
This brings us to the end of the blog. Hope this article gained some knowledge for you!
Thank you for reading.