The spatial characteristics of features can be stored in GIS in one of 2 ways: Vector data or Raster data.
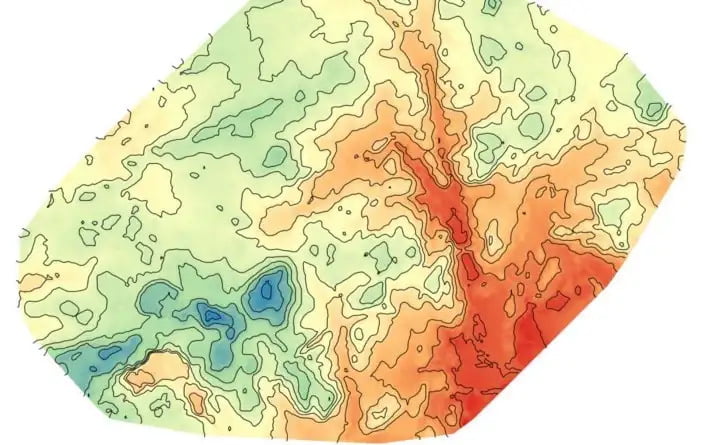
Raster data is made up of pixels (also referred to as grid cells). Each pixel is associated with a specific geographical location. The value of a pixel can be continuous (e.g., Slope) or discrete (e.g., Population Density). It is used in Aerial imagery, satellite images, and shaded relief raster’s as the base layer when making maps.
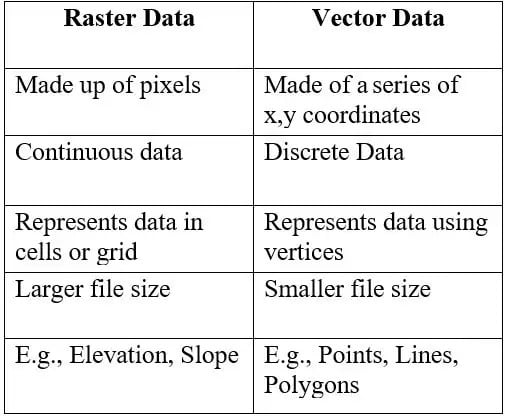
Difference between Raster Data and Vector Data
Vector data is a data structure that can be used to store spatial data. It is used to represent real-world features and assign attributes to those features. It comprises of individual points, stored as coordinate pairs that indicate a physical location in the world. Data in this format can have a geometry type of point, line, and polygon.
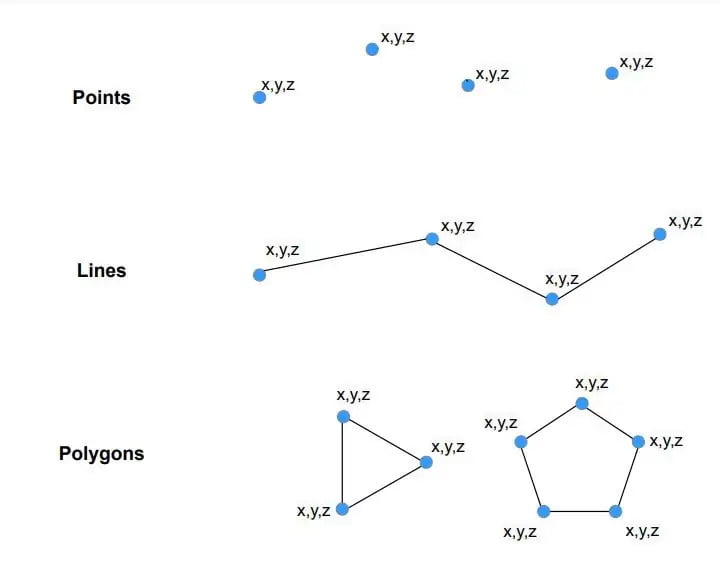
Point: They are simply X, Y, and Z coordinates. It typically represents a geographic feature too small to be displayed as a line or area. These features also consist of a node and vertex. They generally indicate distinct, discrete components such as buildings, trees, power poles, sample locations, etc. They only have the property of the location.

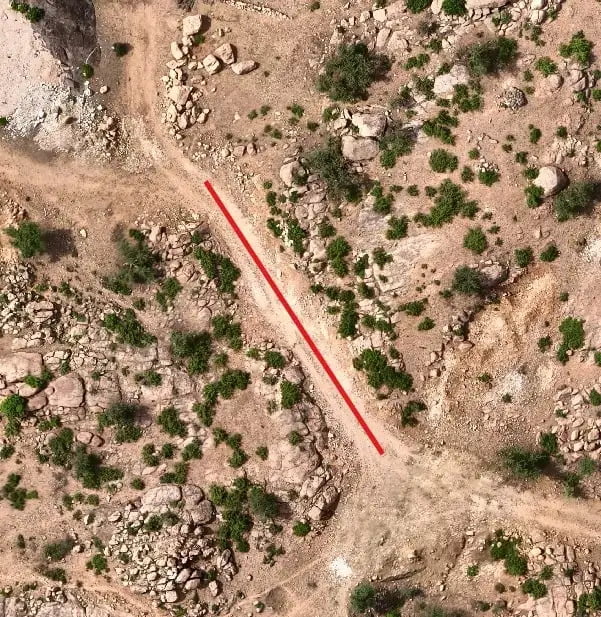
Line: They are composed of many (at least 2) points that are connected. It represents linear features such as roads, streams, faults boundaries, flight paths, and contours. E.g., If you want to express a route on a map, you can use line vector data to display it on a map.
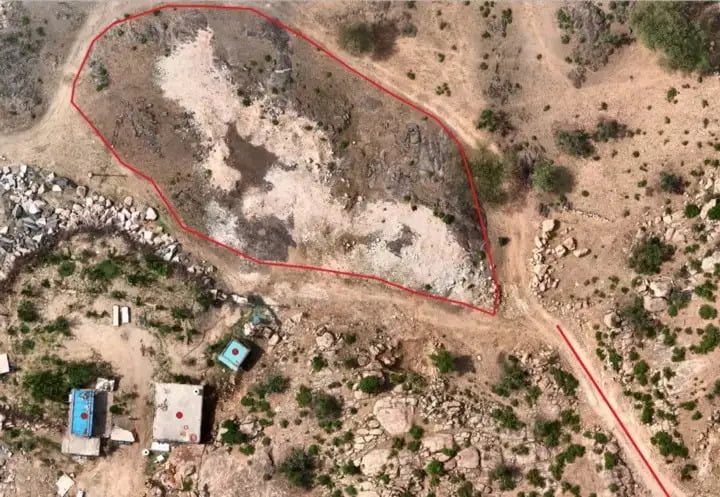
Polygon: It consists of 3 or more vertices connected and closed. They have attributes that describe the geographic feature they represent. They are enclosed areas like dams, lakes, vegetation, country boundaries, etc. Like polyline features, they are created from vertices connected with a continuous line. However, because a polygon always describes an enclosed area, the first and the last vertices should always be in the same place. E.g., If you want the closed boundary of a rock on a map, then you can use polygon vector data to display it on a map.
Advantages of Vector Data
- Topology: It can be wholly described and easy to maintain.
- Storage: Easier to store since it requires less disk storage.
- Spatial resolution: It has high spatial resolution and high-precision graphics.
- Accuracy: It can represent all features will high accuracy.
- Representation: Sharp, Clean, scalable, and aesthetically pleasing.
Disadvantages of Vector Data
- Complexity: It has a complex data structure and algorithms.
- Time Consuming: It depends on the size and number of features, so the editing and processing of vector data can be pretty time-consuming.
- Continuous Data: Continuous data is poorly stored and displayed.
- Compatibility: It is not compatible with remote sensing data.
Vector Data Formats
Each vector format represents a different way of storing geospatial data on a computer. Each data format is more or less suited to specific types of projects.
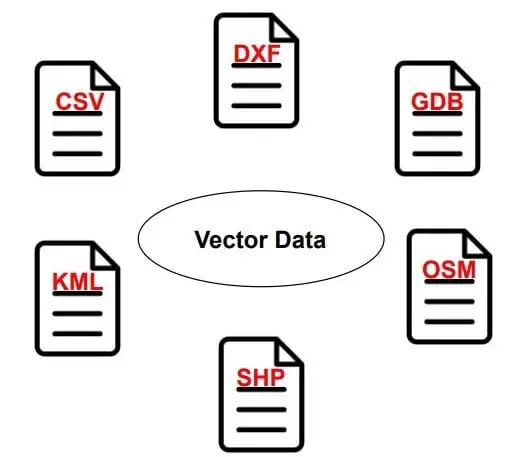
Some of the essential file formats are:
- Shapefile (SHP): It is a popular geospatial vector data format for a geographic information system (G.I.S.) software storing geographic features, location, shape, and attributes.
- Keyhole Markup Language (KML.): It is a standard format for sharing geographic data and visualizing it in three-dimensional earth browsers like Google Earth.
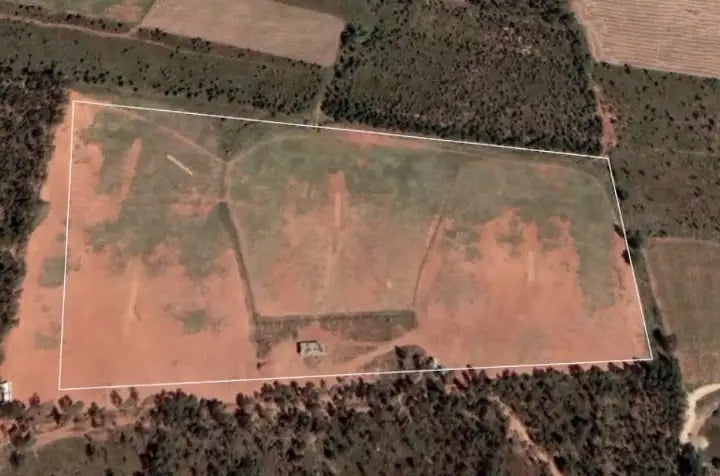
Figure above shows a KML boundary. This is discrete data and contains the location information. We get the coordinates of the points marked here. To get the coordinates right, click the file and open it in notepad.
- AutoCAD Drawing Exchange Format (DXF): A CAD data file format is often used to share drawing data between other CAD programs.
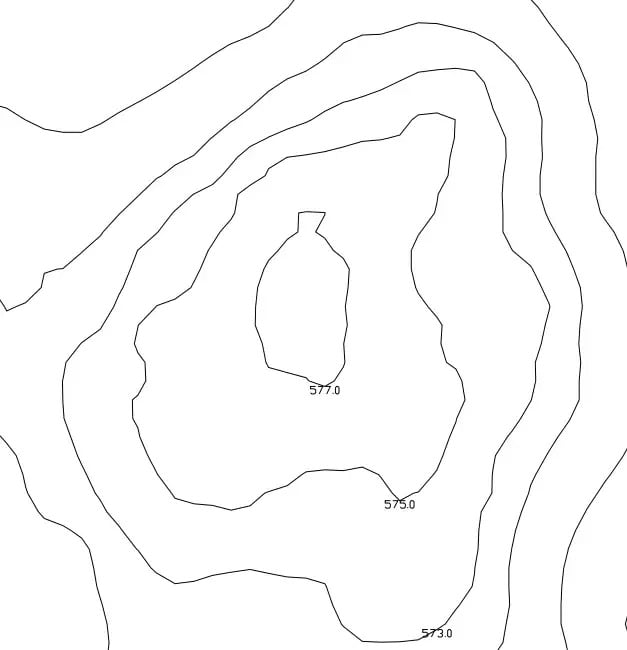
In Figure above, the contour lines are in DXF format and can be opened in AutoCAD. They are discrete and contain the x, y, and z values. In the above figure, only the z coordinates are labeled. If we right-click on any contour file and go to properties, we get the x and y coordinates.
- Comma Separated Values (CSV): It can be visualized as a table that can only represent point data. It is a delimited text file that uses a comma to separate values.
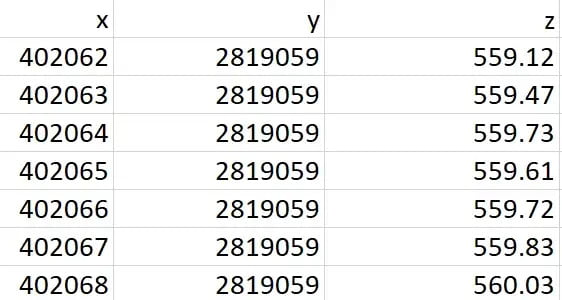
Figure above shows the X, Y, and Z values in a comma-separated value (CSV) file. Here, each row represents a single point, and if we open this file in any G.I.S. software, each row will be displayed as a single point.
- Geodatabase (GDB): An ArcGIS-specific format for editing and data management.
- OpenStreetMap (OSM): It is a key value format written in XML for creating and sharing map information.
This brings us to the end of the blog. Hope this article gained some knowledge for you! Let’s meet in the next article to learn more about Raster Data in GIS.
Thank you for reading.